C. Algebra · Algebra: Patterns, Rational Numbers, Equations, Inequalities, Coding and ModellingMath Modelling: Planning a Maple Syrup Project
C4 A1About 60 minutes
Learning goals- I can use the modelling process (understand, assume, model, check and revise, share) on a real-life situation.
- I can build a model using rates, equations, inequalities, graphs and code.
- I can revise my model when new data shows that an assumption was wrong, and explain my recommendation.
Words to know
mathematical model
A way of using math (equations, graphs, tables or code) to represent a real situation so you can make predictions.
assumption
Something you decide to treat as true so you can build a model, like "each tap gives 2 L of sap a day".
forecast
A prediction based on a model and data.
revise
Change a model after checking it against what really happens.
sap
The watery liquid that flows inside a maple tree. Boiling it down makes maple syrup.
Remember from Grade 7
In Grade 7 you used the modelling process to choose a plan for a winter ski club. You made assumptions, wrote equations and inequalities, and revised your model when facts changed.
In Grade 8 you'll do it again with a bigger toolkit: linear patterns with rates and initial values, equations and inequalities with integers and decimals, and code that analyses data. The new challenge: real data will show that one of the assumptions was off, and you'll have to revise.
The situation
A Grade 8 class has permission to tap some sugar maple trees near the school, with an adult maple producer who will help. They want to make enough syrup for a pancake breakfast for 150 people in the spring.
Maple sap runs in late winter and early spring, when nights are below freezing and days are above freezing. For many First Nations in what is now Ontario, including Anishinaabe and Haudenosaunee communities, making maple sugar and syrup has been part of life for many generations, and many communities continue to gather at the sugar bush today. If a local community or Indigenous education centre shares teachings about the sugar bush, that is a great way to learn more.
How many taps does the class need, and how long will it take to collect enough sap?
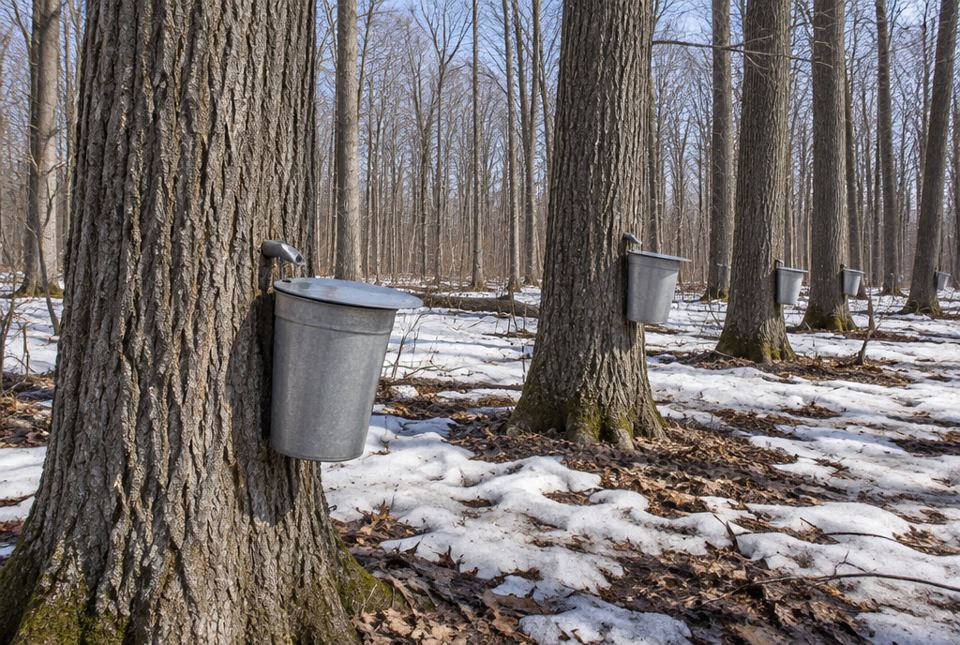 Each spout is one tap, and each bucket slowly fills with sap on days above freezing. To plan the project, the class must decide how many taps they need and how many days of sap flow it will take. AI-generated image
1. Understand the problem
We know: 150 people are coming. Sap is boiled down to make syrup.
We need to find: how much syrup, how much sap, how many taps, and how many days.
We don't know: how much sap each tap will give. That depends on the trees and the weather.
2. Make assumptions
- Each person gets 30 mL of syrup (about 2 tablespoons).
- It takes about 40 L of sap to make 1 L of syrup. (This is a common rule of thumb. The real amount depends on how sweet the sap is.)
- Each tap gives an average of 2 L of sap per day over the season. (Some days give more, and cold days give none.)
- The class can put in 5 taps. (Tapping guides set a minimum trunk size for a tap, so not every tree can be tapped.)
3. Model and solve
Syrup needed: 150 × 30 mL = 4 500 mL = 4.5 L.
Sap needed: 4.5 × 40 = 180 L.
Sap collected: with 5 taps at 2 L each per day, the rate is 10 L per day and the initial value is 0. S = 10d.
Days needed: solve the inequality 10d ≥ 180, so d ≥ 18. The plan needs about 18 days of sap collecting.
Taps for a shorter season: if the season had only 12 good days, the class would need 2 × 12 × t ≥ 180, so 24t ≥ 180 and t ≥ 7.5. Taps come in whole numbers, so 8 taps.
4. Check and revise
After 10 days, the class has real data. They write code to analyse it:
SET sap = [6, 11, 14, 0, 9, 12, 15, 8, 0, 10]
SET total = 0
SET count = 0
FOR EACH s IN sap
ADD s to total
ADD 1 to count
SET mean = total ÷ count
SAY total
SAY mean
IF mean < 10 THEN
SAY "Behind plan: revise"
ELSE
SAY "On track"
The class's code for 10 days of sap totals (litres per day from all 5 taps). Days 4 and 9 were too cold for sap to run.
Outputs: total = 85 L, mean = 8.5 L per day, "Behind plan: revise".
The assumption of 10 L per day was too high. The real rate is 8.5 L per day, which is 8.5 ÷ 5 = 1.7 L per tap per day.
Revised model. The class still needs 180 − 85 = 95 L.
- Option A: keep 5 taps. 8.5d ≥ 95, so d ≥ 11.2. They need 12 more days (about day 22 in total).
- Option B: add taps to finish by day 18 (8 more days). At 1.7 L per tap per day: 1.7 × 8 × t ≥ 95, so 13.6t ≥ 95 and t ≥ 6.99. They need 7 taps, which means adding 2 more.
But the sap season may end soon if the weather warms up. That's a risk to share.
5. Share
The class reports to the principal:
"We need about 180 L of sap to make 4.5 L of syrup for 150 people. After 10 days we have 85 L, which is behind our plan, because our taps are giving about 1.7 L a day each, not 2 L. We recommend adding 2 taps if the maple producer says the trees are big enough, so we can finish in about 8 more days. If not, we need about 12 more days of good sap weather. If the season ends early, we could serve smaller portions: 85 L of sap makes about 2.1 L of syrup, which is about 14 mL each for 150 people."
Safety first
Tapping trees and boiling sap are jobs for adults. Drilling tap holes needs proper tools and the landowner's permission. Boiling sap makes a lot of hot steam, so it is done outdoors or in a well-vented sugar shack, and someone must watch the pan the whole time.
Worked exampleExample: Revising when the portion size changes
The class learns that 200 people are coming, and decides on 25 mL each. With the real rate of 1.7 L per tap per day and 8 days left, how many taps are needed in total? (They already have 85 L of sap.)
- Syrup: 200 × 25 mL = 5 000 mL = 5 L.
- Sap: 5 × 40 = 200 L. Still needed: 200 − 85 = 115 L.
- Inequality: 1.7 × 8 × t ≥ 115, so 13.6t ≥ 115 and t ≥ 8.46.
- Round up to a whole number of taps.
9 taps (4 more than now), if the trees allow it.
Hands-on activityModel your own pancake breakfast
You need: a measuring cup or spoons, syrup (or water to practise with), pencil and paper.
- Understand: how much syrup does your family really use? Measure how much each person pours on a typical serving (pour into a measuring cup, not onto pancakes, if you're just practising with water).
- Assume: use your measurements to choose a serving size. Is 30 mL too much, too little or about right?
- Model: redo the class's calculation with your serving size. How many litres of sap would 150 people need?
- Check and revise: compare your model with the class's. What changed? How many taps and days would your plan need, at 1.7 L per tap per day and 5 taps?
- Share: write three sentences to the class explaining your recommendation.
Example: with 20 mL each: 150 × 20 mL = 3 L of syrup, 120 L of sap. At 8.5 L per day with 5 taps: 8.5d ≥ 120 gives d ≥ 14.1, so 15 days.
Just for fun: sap mathMaple sap is mostly water: usually only about 2 to 3% sugar. That's why it takes around 40 L of sap to make 1 L of syrup. So every 30 mL serving on your pancakes started out as about 1.2 L of sap!
Your turn
1How much syrup is needed for 150 people at 30 mL each? Give your answer in litres.
4.5 L. 150 × 30 = 4 500 mL.
2Using the 40 to 1 rule of thumb, how much sap makes 4.5 L of syrup?
3Write an equation for the sap collected by 5 taps at 2 L per tap per day.
S = 10d. The rate is 5 × 2 = 10 L per day, and the initial value is 0.
4Which assumption turned out to be wrong, and how did the class find out?
The 2 L per tap per day assumption. Their code found a real mean of 8.5 L per day for 5 taps, which is 1.7 L per tap per day.
5With 5 taps at the real rate, how many more days are needed to collect the last 95 L?
12 days. 8.5d ≥ 95 → d ≥ 11.2, so round up to 12.
6Why do you round up the number of taps and days, instead of rounding to the nearest whole number?
Because rounding down would give not quite enough sap. For example, 7.5 taps rounds to 8, and 11.2 days rounds up to 12 to make sure the goal is reached.
More practice: warm-up
1How many millilitres are in 1 L?
2How much syrup do 10 people need at 30 mL each?
3How much sap makes 2 L of syrup (40 to 1)?
4If 4 taps each give 2 L a day, how much sap is collected per day?
5Name the five steps of the modelling process.
Understand, assume, model, check and revise, share.
More practice: on your own
1The sap from one tree turns out to be extra sweet, so only 32 L of sap makes 1 L of syrup. How much sap is needed for 4.5 L of syrup?
2Using the class's data list, what would the code's mean be if the two cold days (0 L) were left out of the list?
About 10.6 L per day. The total is still 85 L, but over 8 days: 85 ÷ 8 = 10.625.
3Is it fair to leave out the cold days when forecasting? Explain.
Usually not. Cold days with no sap are part of a real season, so leaving them out would make the forecast too hopeful. Including them gives a more realistic average (8.5 L per day).
4With 6 taps at 1.7 L per tap per day, how many days would the original 180 L take from the start of the season?
18 days (17.6 rounded up). 6 × 1.7 = 10.2 L per day. 10.2d ≥ 180 → d ≥ 17.6.
5Write an inequality for the number of taps t needed to collect at least 60 L in 5 days at 1.7 L per tap per day. Solve it.
8.5t ≥ 60, so t ≥ 7.06, which means 8 taps. 1.7 × 5 = 8.5 L per tap over 5 days.
Challenge
1The class keeps 5 taps. Write an equation for the total sap after day 10 using the real rate, with day 10 as the start (initial value 85 L). On which day will they reach 180 L?
S = 85 + 8.5n, where n is the number of days after day 10. They reach 180 L on day 22. 85 + 8.5n ≥ 180 → n ≥ 11.2, so n = 12, which is day 10 + 12 = 22. (After 11 more days: 85 + 93.5 = 178.5, not enough.)
2Write an extra line of code for the class's program that counts the cold days (days with 0 L). What does it say?
Model answer: SET cold = 0 before the loop; inside the loop add IF s = 0 THEN ADD 1 to cold; after the loop SAY cold. It says 2.
3The season ends after day 16. The class used 5 taps, and days 11 to 16 gave 9, 7, 0, 11, 10 and 8 L. How much syrup can they make, and how big can each of the 150 servings be?
About 3.25 L of syrup, about 21.7 mL each. Days 11 to 16: 9 + 7 + 0 + 11 + 10 + 8 = 45 L. Total sap: 85 + 45 = 130 L. Syrup: 130 ÷ 40 = 3.25 L = 3 250 mL. 3 250 ÷ 150 ≈ 21.7 mL each.
Quiz
1. What is the first step of the modelling process?
2. Which of these is an assumption in the maple syrup model?
3. How much sap is needed for 3 L of syrup, using the 40 to 1 rule of thumb?
4. The plan said 10 L per day, but the data showed 8.5 L per day. What should the class do?
5. Solve 8.5d ≥ 51 for a whole number of days.
6. Why did the class write code in this model?
Big idea: C4 asks Grade 8 students to apply the process of mathematical modelling to represent, analyse, make predictions and provide insight into real-life situations. A model is never "finished": students check it against real data and revise it.
Common difficulties:
- Treating assumptions as facts. Ask "How do we know that? What if it's wrong?"
- Rounding down when the answer must be enough (taps, days, buses). Round up.
- Unit mix-ups between mL and L.
- Leaving out the "share" step. A recommendation should explain the reasoning and the risks.
Safety: tapping trees and boiling sap are adult jobs. Boiling produces a lot of steam and must be supervised the whole time, outdoors or with good ventilation. Only tap trees with the landowner's permission.
How to help: Try the pancake breakfast activity and let your child lead the explanation. If your community has a maple syrup festival or a sugar bush open to visitors, that's a great real-life connection. This lesson builds A1 skills: perseverance, critical thinking and communicating.